1
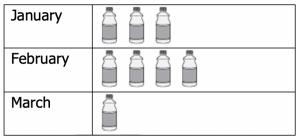
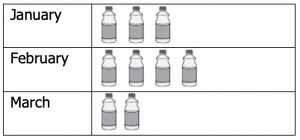
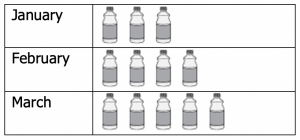
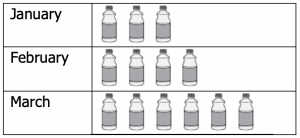
The table below shows the number of bottles of 1 kg oil sold by an emporium in three months. The sale of oil in March exceeded the sale in January by 100 bottles.
| Month | Number of bottles |
| January | 150 |
| February | 200 |
| March |
Which of the following pictograph represents the sale of oil for the three months?